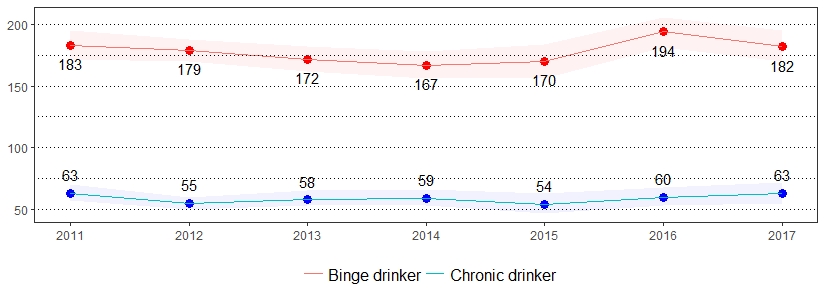
Excessive alcohol use contributes to approximately 88,000 deaths each year within the United States.1 The estimate(s) of adults who indicated binge drinking, chronic drinking or being at risk for problem drinking are shown below.
| Binge Drinking* ** | At Risk for Problem Drinking* *** | Chronic Drinking* **** | ||||
|---|---|---|---|---|---|---|
| Demographics | % | CI | % | CI | % | CI |
| All adults | 18 | 17-20 | 6 | 6-7 | 6 | 6-7 |
| Gender | ||||||
| Male | 23 | 21-25 | 7 | 6-9 | 11 | 9-12 |
| Female | 13 | 12-15 | 5 | 5-6 | 2 | 2-3 |
| Age | ||||||
| 18-29 | 30 | 26-34 | 8 | 6-11 | 6 | 4-9 |
| 30-44 | 26 | 23-29 | 7 | 6-9 | 7 | 6-9 |
| 45-64 | 15 | 14-18 | 6 | 5-8 | 6 | 5-8 |
| 65+ | 5 | 4-6 | 4 | 3-5 | 5 | 4-7 |
| Education | ||||||
| < High school | 11 | 7-16 | 7 | 4-11 | 9 | 5-14 |
| High school | 16 | 14-18 | 6 | 5-7 | 6 | 5-7 |
| Some college | 20 | 18-23 | 7 | 6-9 | 6 | 5-8 |
| College degree | 22 | 20-24 | 7 | 6-8 | 6 | 5-7 |
| Household income | ||||||
| < $15,000 | 16 | 13-21 | 6 | 4-10 | 6 | 4-9 |
| $15,000 to $24,999 | 14 | 11-17 | 6 | 4-8 | 6 | 4-8 |
| $25,000 to $49,999 | 16 | 14-19 | 7 | 5-9 | 6 | 5-8 |
| $50,000 to $74,999 | 19 | 15-22 | 7 | 5-9 | 7 | 5-9 |
| $75,000+ | 25 | 23-28 | 7 | 6-9 | 8 | 6-10 |
| Race | ||||||
| White, non-Hispanic | 19 | 18-20 | 6 | 6-7 | 7 | 6-8 |
| Black, non-Hispanic | 17 | 13-22 | 7 | 4-10 | 5 | 3-9 |
| Hispanic | 18 | 13-25 | 8 | 5-12 | 6 | 3-10 |
| Sexual orientation | ||||||
| Lesbian, gay or bisexual | 29 | 22-38 | 8 | 5-13 | 8 | 5-14 |
| Straight | 17 | 16-18 | 6 | 5-7 | 6 | 5-7 |
*Excludes missing, don't know and refused
**Defined as having five or more drinks on one occasion for men and having four or more drinks on one occasion for women
***Defined as adult men having more than two drinks per day and adult women having more than one drink per day
****Defined as having an average of two drinks or more every day for the past 30 days
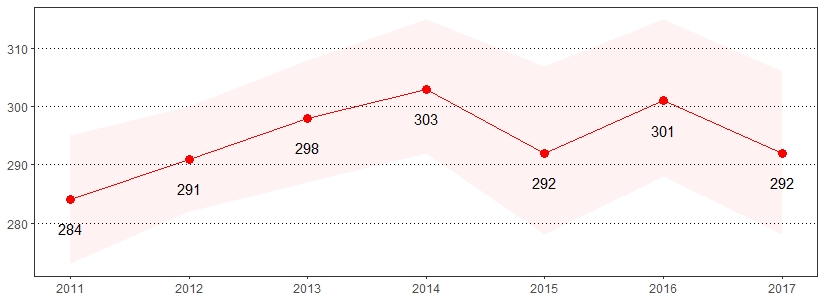
Arthritis and rheumatism are the leading causes of disability within the United States. Symptoms of arthritis include pain, aching, stiffness and swelling in or around the joints.2 The estimate(s) of adults who indicated they were ever told they have some form of arthritis, rheumatoid arthritis, gout, lupus or fibromyalgia are shown below.
| Ever Told Have Some Form of Arthritis* | ||
|---|---|---|
| Demographics | % | CI |
| All adults | 29 | 28-31 |
| Gender | ||
| Male | 25 | 23-27 |
| Female | 33 | 31-35 |
| Age | ||
| 18-29 | 5 | 3-7 |
| 30-44 | 14 | 11-16 |
| 45-64 | 36 | 34-39 |
| 65+ | 55 | 52-58 |
| Education | ||
| < High school | 36 | 30-43 |
| High school | 33 | 31-36 |
| Some college | 29 | 26-31 |
| College degree | 21 | 19-23 |
| Household income | ||
| < $15,000 | 40 | 35-45 |
| $15,000 to $24,999 | 39 | 35-43 |
| $25,000 to $49,999 | 31 | 28-34 |
| $50,000 to $74,999 | 27 | 23-31 |
| $75,000+ | 20 | 18-22 |
| Race | ||
| White, non-Hispanic | 32 | 30-33 |
| Black, non-Hispanic | 27 | 23-31 |
| Hispanic | 16 | 11-22 |
| Sexual orientation | ||
| Lesbian, gay or bisexual | 21 | 14-29 |
| Straight | 32 | 30-34 |
*Excludes missing, don't know and refused
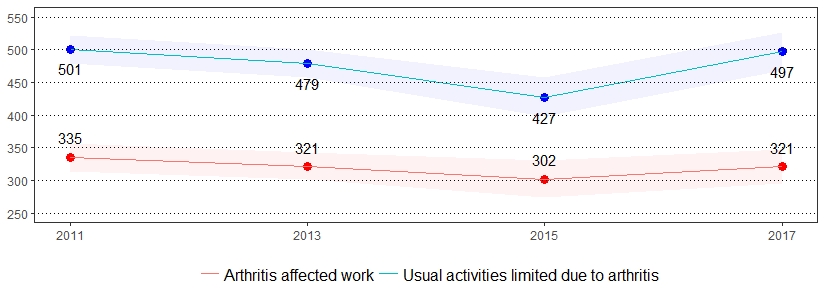
23.7 million, or 43.5 percent of United States adults report limitations in their usual activities due to arthritis.3 The estimate(s) of adults who indicated their usual activities were limited due to arthritis or joint symptoms, arthritis or joint symptoms affected work or arthritis or joint symptoms interfered with social activities are shown below.
| Usual Activities Limited Due to Arthritis or Joint Symptoms* ** | Arthritis or Joint Symptoms Affected Work* ** | Arthritis or Joint Symptoms Interfered with Social Activities* ** |
||||
|---|---|---|---|---|---|---|
| Demographics | % | CI | % | CI | % | CI |
| All adults | 50 | 47-53 | 32 | 29-35 | 47 | 44-50 |
| Gender | ||||||
| Male | 50 | 46-55 | 34 | 30-39 | 45 | 40-49 |
| Female | 49 | 46-53 | 30 | 27-34 | 48 | 45-52 |
| Age | ||||||
| 18-29 | NSR | NSR | NSR | NSR | NSR | NSR |
| 30-44 | 53 | 44-63 | 40 | 31-50 | 54 | 44-63 |
| 45-64 | 58 | 54-62 | 44 | 40-49 | 52 | 48-57 |
| 65+ | 41 | 37-46 | 17 | 14-21 | 40 | 36-45 |
| Education | ||||||
| < High school | 56 | 45-66 | 31 | 23-41 | 64 | 54-74 |
| High school | 51 | 47-56 | 38 | 34-43 | 50 | 45-54 |
| Some college | 49 | 44-54 | 31 | 27-36 | 45 | 40-50 |
| College degree | 43 | 38-48 | 21 | 18-25 | 32 | 28-36 |
| Household income | ||||||
| < $15,000 | 68 | 60-76 | 53 | 45-61 | 73 | 65-80 |
| $15,000 to $24,999 | 59 | 53-66 | 34 | 28-40 | 63 | 57-69 |
| $25,000 to $49,999 | 50 | 44-56 | 34 | 28-40 | 46 | 40-52 |
| $50,000 tot $74,999 | 46 | 38-54 | 33 | 26-40 | 35 | 28-42 |
| $75,000+ | 40 | 34-46 | 23 | 18-29 | 31 | 25-37 |
| Race | ||||||
| White, non-Hispanic | 49 | 46-52 | 30 | 28-33 | 45 | 41-48 |
| Black, non-Hispanic | 48 | 39-58 | 41 | 32-51 | 54 | 44-63 |
| Hispanic | NSR | NSR | NSR | NSR | NSR | NSR |
| Sexual orientation | ||||||
| Lesbian, gay or bisexual | NSR | NSR | NSR | NSR | NSR | NSR |
| Straight | 50 | 46-53 | 32 | 29-35 | 46 | 43-49 |
*Excludes missing, don't know and refused
**Out of adults who were told they have some form or arthritis
Note: If "NSR" is displayed, then the total response is less than 50 and/or the percentage prevalence is considered "not statistically reliable."
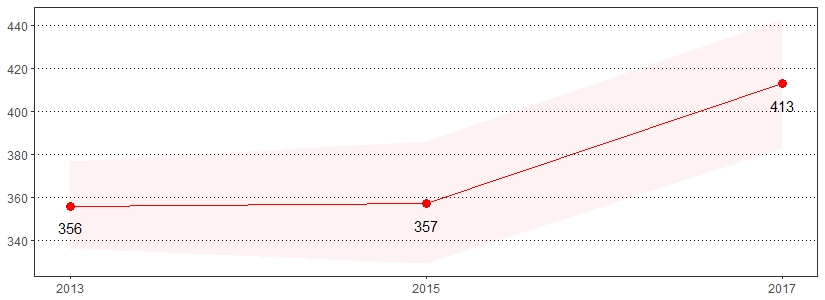
Exercise is crucial for people with arthritis. It increases strength and flexibility, reduces joint pain, and helps combat fatigue.4 The estimate(s) of adults who indicated a doctor or health professional ever suggested losing weight to help arthritis or joint symptoms, a doctor or health professional ever suggested physical activity or exercise to help arthritis or joint symptoms or taken a class to manage arthritis or joint symptoms are shown below.
| A Doctor/Health Professional Ever Suggested Losing Weight to Help Arthritis/Joint Symptoms* ** | A Doctor/Health Professional Ever Suggested Physical Activity/Exercise to Help Arthritis/Joint Symptoms* ** | Taken Class to Manage Arthritis or Joint Symptoms* ** | ||||
|---|---|---|---|---|---|---|
| Demographics | % | CI | % | CI | % | CI |
| All adults | 41 | 38-44 | 59 | 56-62 | 13 | 11-15 |
| Gender | ||||||
| Male | 44 | 39-49 | 57 | 53-62 | 12 | 9-15 |
| Female | 40 | 36-43 | 61 | 57-65 | 14 | 11-16 |
| Age | ||||||
| 18-29 | NSR | NSR | NSR | NSR | NSR | NSR |
| 30-44 | 45 | 35-56 | 58 | 47-68 | 16 | 9-25 |
| 45-64 | 42 | 38-47 | 65 | 61-69 | 13 | 11-17 |
| 65+ | 40 | 36-45 | 54 | 49-58 | 11 | 9-14 |
| Education | ||||||
| < High school | 38 | 28-49 | 53 | 41-64 | 7 | 3-14 |
| High school | 39 | 34-44 | 57 | 52-62 | 13 | 10-16 |
| Some college | 44 | 38-49 | 62 | 57-67 | 15 | 12-20 |
| College degree | 46 | 41-51 | 65 | 61-70 | 15 | 12-19 |
| Household income | ||||||
| < $15,000 | 42 | 34-51 | 54 | 45-62 | 17 | 11-24 |
| $15,000 to $24,999 | 41 | 34-48 | 60 | 53-67 | 13 | 9-19 |
| $25,000 to $49,999 | 41 | 35-47 | 62 | 55-67 | 11 | 8-15 |
| $50,000 tot $74,999 | 41 | 33-49 | 60 | 52-68 | 15 | 10-22 |
| $75,000+ | 41 | 34-47 | 56 | 50-63 | 13 | 9-19 |
| Race | ||||||
| White, non-Hispanic | 40 | 37-43 | 58 | 55-62 | 12 | 10-14 |
| Black, non-Hispanic | 43 | 33-53 | 71 | 61-79 | 17 | 11-26 |
| Hispanic | NSR | NSR | NSR | NSR | NSR | NSR |
| Sexual orientation | ||||||
| Lesbian, gay or bisexual | NSR | NSR | NSR | NSR | NSR | NSR |
| Straight | 40 | 37-44 | 60 | 57-63 | 13 | 11-15 |
*Excludes missing, don't know and refused
**Out of adults who were told they have some form or arthritis
Note: If "NSR" is displayed, then the total response is less than 50 and/or the percentage prevalence is considered "not statistically reliable."
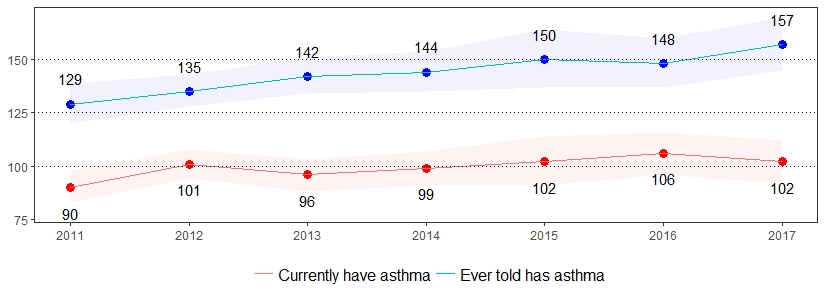
Asthma is a chronic inflammatory disorder of the lungs, characterized by wheezing, coughing, difficulty breathing and chest tightness.5 The estimate(s) of adults who indicated they ever had asthma or currently have asthma are shown below.
| Ever Told Have Asthma* | Currently Has Asthma* | |||
|---|---|---|---|---|
| Demographics | % | CI | % | CI |
| All adults | 16 | 15-17 | 10 | 9-11 |
| Gender | ||||
| Male | 13 | 12-15 | 7 | 6-8 |
| Female | 18 | 16-20 | 13 | 12-15 |
| Age | ||||
| 18-29 | 23 | 19-27 | 12 | 9-16 |
| 30-44 | 19 | 16-21 | 12 | 10-15 |
| 45-64 | 13 | 12-15 | 10 | 8-11 |
| 65+ | 11 | 9-13 | 7 | 6-9 |
| Education | ||||
| < High school | 20 | 15-27 | 16 | 11-22 |
| High school | 13 | 11-15 | 9 | 7-10 |
| Some college | 17 | 15-20 | 11 | 9-13 |
| College degree | 16 | 14-17 | 9 | 8-11 |
| Household income | ||||
| < $15,000 | 24 | 19-29 | 19 | 15-24 |
| $15,000 to $24,999 | 16 | 13-19 | 11 | 9-15 |
| $25,000 to $49,999 | 15 | 12-17 | 9 | 7-11 |
| $50,000 to $74,999 | 14 | 11-17 | 9 | 7-11 |
| $75,000+ | 14 | 12-17 | 9 | 7-11 |
| Race | ||||
| White, non-Hispanic | 15 | 14-17 | 10 | 9-11 |
| Black, non-Hispanic | 15 | 11-18 | 11 | 8-14 |
| Hispanic | 27 | 21-35 | 16 | 11-22 |
| Sexual orientation | ||||
| Lesbian, gay or bisexual | 22 | 16-30 | 14 | 9-22 |
| Straight | 16 | 15-17 | 10 | 9-12 |
*Excludes missing, don't know and refused
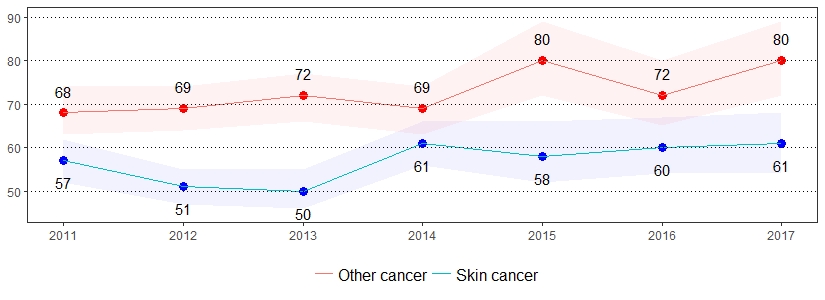
Cancer is the second leading cause of death in the United States.6 The estimate(s) of adults who indicated they were ever told they had skin cancer and ever told they had any other type of cancer are shown below.
| Ever Told Had Skin Cancer* | Ever Told Had Any Other Type of Cancer* |
|||
|---|---|---|---|---|
| Demographics | % | CI | % | CI |
| All adults | 6 | 5-7 | 8 | 7-9 |
| Gender | ||||
| Male | 7 | 6-8 | 6 | 5-7 |
| Female | 5 | 5-6 | 10 | 9-11 |
| Age | ||||
| 18-29 | 0 | 0-1 | 1 | 0-2 |
| 30-44 | 1 | 1-3 | 3 | 2-4 |
| 45-64 | 6 | 5-7 | 8 | 7-10 |
| 65+ | 16 | 14-18 | 19 | 17-22 |
| Education | ||||
| < High school | 6 | 4-9 | 10 | 6-15 |
| High school | 6 | 5-7 | 9 | 7-10 |
| Some college | 5 | 4-7 | 8 | 6-9 |
| College degree | 7 | 6-9 | 7 | 6-8 |
| Household income | ||||
| < $15,000 | 3 | 2-5 | 9 | 6-12 |
| $15,000 to $24,999 | 6 | 4-8 | 10 | 8-13 |
| $25,000 to $49,999 | 7 | 5-9 | 9 | 7-11 |
| $50,000 to $74,999 | 5 | 4-7 | 8 | 6-10 |
| $75,000+ | 6 | 5-8 | 6 | 5-8 |
| Race | ||||
| White, non-Hispanic | 8 | 7-9 | 9 | 8-10 |
| Black, non-Hispanic | 0 | 0-1 | 7 | 5-10 |
| Hispanic | 0 | 0-2 | 6 | 3-11 |
| Sexual orientation | ||||
| Lesbian, gay or bisexual | 4 | 1-9 | 4 | 2-8 |
| Straight | 7 | 6-8 | 9 | 8-10 |
*Excludes missing, don't know and refused
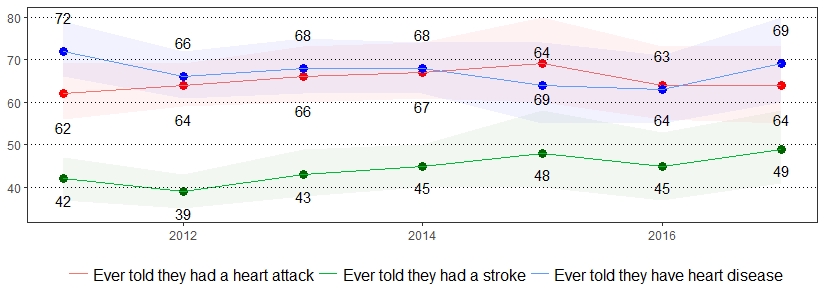
Cardiovascular disease is the leading cause of death for men and women in the United States.7 The estimate(s) of adults age 35 and older who indicated they had a heart attack, heart disease or stroke, ever had a heart attack, ever had angina or heart disease, or ever had a stroke are shown below.
| Ever Told Had Heart Attack, Heart Disease or Stroke* | Ever Told They Had a Heart Attack* | Ever Told They Had Angina or Heart Disease* | Ever Told They Had a Stroke* | |||||
|---|---|---|---|---|---|---|---|---|
| Demographics | % | CI | % | CI | % | CI | % | CI |
| All adults | 14 | 12-15 | 6 | 6-7 | 7 | 6-8 | 5 | 4-6 |
| Gender | ||||||||
| Male | 16 | 14-18 | 8 | 7-10 | 8 | 7-10 | 5 | 4-7 |
| Female | 11 | 10-13 | 5 | 4-6 | 6 | 4-7 | 4 | 4-5 |
| Age | ||||||||
| 35-44 | 4 | 2-6 | 2 | 1-4 | 2 | 1-4 | 1 | 1-2 |
| 45-54 | 7 | 5-9 | 3 | 2-4 | 3 | 2-5 | 3 | 2-6 |
| 55-64 | 15 | 12-18 | 8 | 6-10 | 7 | 5-9 | 5 | 4-7 |
| 65+ | 24 | 21-27 | 11 | 9-13 | 13 | 11-16 | 8 | 7-10 |
| Education | ||||||||
| < High school | 27 | 21-35 | 13 | 8-19 | 11 | 7-18 | 10 | 7-16 |
| High school | 16 | 14-18 | 7 | 6-9 | 8 | 7-10 | 5 | 4-7 |
| Some college | 11 | 10-14 | 5 | 4-7 | 6 | 5-8 | 4 | 3-6 |
| College degree | 8 | 6-9 | 4 | 3-5 | 4 | 3-5 | 3 | 2-4 |
| Household income | ||||||||
| < $15,000 | 25 | 20-31 | 13 | 9-19 | 12 | 8-16 | 11 | 7-16 |
| $15,000 to $24,999 | 21 | 17-26 | 10 | 8-14 | 8 | 6-11 | 9 | 6-13 |
| $25,000 to $49,999 | 15 | 13-18 | 7 | 5-9 | 9 | 7-12 | 5 | 3-7 |
| $50,000 to $74,999 | 12 | 9-16 | 6 | 3-9 | 7 | 4-10 | 3 | 2-5 |
| $75,000+ | 6 | 5-8 | 3 | 2-3 | 4 | 3-5 | 2 | 1-3 |
| Race | ||||||||
| White, non-Hispanic | 14 | 13-16 | 7 | 6-8 | 7 | 6-8 | 5 | 4-6 |
| Black, non-Hispanic | 12 | 9-16 | 5 | 3-7 | 6 | 4-9 | 6 | 4-9 |
| Hispanic | 15 | 9-25 | 8 | 3-17 | 4 | 2-11 | 7 | 4-14 |
| Sexual orientation | ||||||||
| Lesbian, gay or bisexual | NSR | NSR | 3 | 1-7 | 6 | 2-13 | NSR | NSR |
| Straight | 14 | 13-15 | 7 | 6-8 | 7 | 6-9 | 5 | 4-6 |
*Excludes missing, don't know and refused
Note: If "NSR" is displayed, then the total response is less than 50 and/or the percentage prevalence is considered "not statistically reliable."
Approximately 39.8 million caregivers, or 16.6 percent, provide care to adults with a disability or illness.8 The estimate(s) of adults who indicated they provided regular care or assistance to a friend or family member who has a health problem or disability in the past month, averaged up to eight hours per week in the past month providing care or assistance to a friend or family member who has a health problem or disability or averaged 40 hours or more per week in the past month providing care or assistance to a friend or family member who has a health problem or disability are shown below.
| Provided Regular Care/Assistance to Friend/Family Member Who Has Health Problem/Disability in the Past Month* | Averaged Up to 8 Hours/Week in the Past Month Providing Care/Assistance to Friend/Family Member Who Has Health Problem/Disability* | Averaged 40 Hours or More per Week in the Past Month Providing Care/Assistance to Friend/Family Member Who Has Health Problem/Disability* | ||||
|---|---|---|---|---|---|---|
| Demographics | % | CI | % | CI | % | CI |
| All adults | 24 | 23-26 | 60 | 56-64 | 19 | 16-22 |
| Gender | ||||||
| Male | 22 | 20-25 | 64 | 58-69 | 17 | 13-22 |
| Female | 26 | 24-29 | 57 | 52-62 | 21 | 17-25 |
| Age | ||||||
| 18-29 | 15 | 12-19 | 66 | 52-77 | 8 | 3-19 |
| 30-44 | 23 | 20-27 | 54 | 45-63 | 21 | 15-30 |
| 45-64 | 29 | 26-31 | 61 | 56-66 | 19 | 15-24 |
| 65+ | 26 | 23-29 | 62 | 55-69 | 22 | 16-29 |
| Education | ||||||
| < High school | 23 | 17-31 | NSR | NSR | NSR | NSR |
| High school | 26 | 23-29 | 58 | 52-64 | 23 | 18-29 |
| Some college | 25 | 22-28 | 62 | 55-68 | 19 | 14-25 |
| College degree | 22 | 20-24 | 65 | 59-70 | 11 | 8-15 |
| Household income | ||||||
| < $15,000 | 26 | 21-32 | 33 | 24-45 | 30 | 21-42 |
| $15,000 to $24,999 | 27 | 23-32 | 48 | 39-58 | 24 | 17-34 |
| $25,000 to $49,999 | 27 | 24-31 | 62 | 54-69 | 19 | 13-27 |
| $50,000 to $74,999 | 26 | 22-31 | 64 | 55-72 | 17 | 11-25 |
| $75,000+ | 21 | 18-23 | 74 | 68-79 | 13 | 9-18 |
| Race | ||||||
| White, non-Hispanic | 25 | 23-27 | 62 | 58-66 | 18 | 15-21 |
| Black, non-Hispanic | 26 | 21-31 | 51 | 39-62 | 22 | 14-34 |
| Hispanic | 22 | 15-30 | NSR | NSR | NSR | NSR |
| Sexual orientation | ||||||
| Lesbian, gay or bisexual | 28 | 20-37 | NSR | NSR | NSR | NSR |
| Straight | 24 | 23-26 | 60 | 56-64 | 20 | 17-23 |
*Excludes missing, don't know and refused
Note: If "NSR" is displayed, then the total response is less than 50 and/or the percentage prevalence is considered "not statistically reliable."
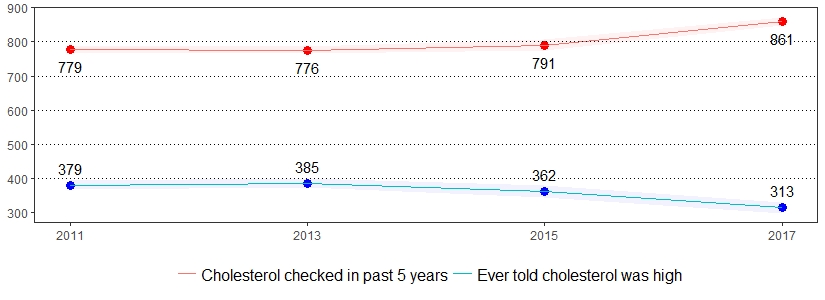
High blood cholesterol is a major risk factor for coronary heart disease.9 The estimate(s) of adults who indicated they had their blood cholesterol checked in the past five years, were ever told they have high blood cholesterol or are currently taking medicine for high blood cholesterol are shown below.
| Blood Cholesterol Checked in the Past 5 Years* | Ever Told Have High Blood Cholesterol* | Currently Taking Medicine for High Blood Cholesterol* | ||||
|---|---|---|---|---|---|---|
| Demographics | % | CI | % | CI | % | CI |
| All adults | 86 | 85-87 | 31 | 30-33 | 59 | 56-62 |
| Gender | ||||||
| Male | 84 | 82-86 | 33 | 30-35 | 62 | 58-66 |
| Female | 88 | 86-90 | 30 | 28-32 | 56 | 52-59 |
| Age | ||||||
| 18-29 | 69 | 64-73 | 7 | 5-10 | 3 | 1-11 |
| 30-44 | 78 | 75-82 | 17 | 14-20 | 22 | 15-31 |
| 45-64 | 92 | 90-93 | 39 | 37-42 | 57 | 53-61 |
| 65+ | 97 | 96-98 | 50 | 47-53 | 78 | 74-81 |
| Education | ||||||
| < High school | 82 | 75-87 | 33 | 27-40 | 72 | 60-81 |
| High school | 86 | 84-88 | 34 | 31-37 | 62 | 57-67 |
| Some college | 84 | 82-87 | 30 | 27-33 | 52 | 47-58 |
| College degree | 89 | 88-91 | 28 | 26-31 | 54 | 50-59 |
| Household income | ||||||
| < $15,000 | 83 | 78-87 | 36 | 31-42 | 60 | 50-68 |
| $15,000 to $24,999 | 86 | 83-89 | 32 | 27-36 | 73 | 66-79 |
| $25,000 to $49,999 | 85 | 82-87 | 31 | 28-34 | 62 | 56-67 |
| $50,000 to $74,999 | 84 | 80-87 | 32 | 28-36 | 52 | 44-59 |
| $75,000+ | 88 | 86-90 | 29 | 27-32 | 53 | 48-58 |
| Race | ||||||
| White, non-Hispanic | 86 | 85-88 | 33 | 31-35 | 60 | 57-63 |
| Black, non-Hispanic | 88 | 84-91 | 29 | 25-34 | 56 | 46-65 |
| Hispanic | 83 | 77-88 | 22 | 17-29 | NSR | NSR |
| Sexual orientation | ||||||
| Lesbian, gay or bisexual | 90 | 84-94 | 20 | 14-28 | NSR | NSR |
| Straight | 86 | 85-88 | 33 | 32-35 | 60 | 56-63 |
*Excludes missing, don't know and refused
Note: If "NSR" is displayed, then the total response is less than 50 and/or the percentage prevalence is considered "not statistically reliable."
Chronic obstructive pulmonary disease (COPD) is a progressive disease that usually results in coughing, wheezing, shortness of breath, chest tightness and other symptoms.10 The estimate(s) of adults who indicated they were ever told they have COPD, emphysema or chronic bronchitis are shown below.
| Ever Told They Have COPD, Emphysema or Chronic Bronchitis* | ||
|---|---|---|
| Demographics | % | CI |
| All adults | 7 | 6-7 |
| Gender | ||
| Male | 7 | 6-8 |
| Female | 7 | 6-8 |
| Age | ||
| 18-29 | 1 | 0-2 |
| 30-44 | 3 | 2-5 |
| 45-64 | 9 | 8-11 |
| 65+ | 11 | 10-13 |
| Education | ||
| < High school | 12 | 9-17 |
| High school | 8 | 7-9 |
| Some college | 6 | 5-7 |
| College degree | 3 | 3-4 |
| Household income | ||
| < $15,000 | 13 | 10-17 |
| $15,000 to $24,999 | 11 | 9-14 |
| $25,000 to $49,999 | 7 | 5-9 |
| $50,000 to $74,999 | 5 | 4-7 |
| $75,000+ | 3 | 2-4 |
| Race | ||
| White, non-Hispanic | 7 | 6-8 |
| Black, non-Hispanic | 6 | 4-9 |
| Hispanic | 4 | 2-7 |
| Sexual orientation | ||
| Lesbian, gay or bisexual | 6 | 3-11 |
| Straight | 7 | 6-8 |
*Excludes missing, don't know and refused
Depression is a common and treatable medical disorder that is more common among individuals with chronic conditions such as obesity, diabetes and arthritis.11 The estimate(s) of adults who indicated they were ever told they have a depressive disorder, including depression, major depression, minor depression or dysthymia are shown below.
| Ever Told They Have Some Form of Depressive Disorder* | ||
|---|---|---|
| Demographics | % | CI |
| All adults | 20 | 18-21 |
| Gender | ||
| Male | 15 | 13-16 |
| Female | 24 | 22-26 |
| Age | ||
| 18-29 | 20 | 17-24 |
| 30-44 | 22 | 19-25 |
| 45-64 | 22 | 20-24 |
| 65+ | 13 | 11-15 |
| Education | ||
| < High school | 22 | 17-28 |
| High school | 19 | 17-21 |
| Some college | 24 | 21-26 |
| College degree | 16 | 14-18 |
| Household income | ||
| < $15,000 | 35 | 30-40 |
| $15,000 to $24,999 | 27 | 23-31 |
| $25,000 to $49,999 | 19 | 17-22 |
| $50,000 to $74,999 | 18 | 15-22 |
| $75,000+ | 15 | 13-17 |
| Race | ||
| White, non-Hispanic | 20 | 19-22 |
| Black, non-Hispanic | 18 | 14-22 |
| Hispanic | 20 | 15-26 |
| Sexual orientation | ||
| Lesbian, gay or bisexual | 33 | 25-42 |
| Straight | 19 | 18-21 |
*Excludes missing, don't know and refused
Diabetes is the seventh leading cause of death in the United States.6 The estimate(s) of adults who indicated they were ever told they have diabetes, check their blood sugar daily, are now taking insulin and saw a doctor four or more times in the past year for diabetes are shown below.
| Ever Told Have Diabetes* | Check Their Blood Sugar Daily* ** |
Now Taking Insulin* ** | Saw Doctor 4+ Times in Past Year for Diabetes* ** |
|||||
|---|---|---|---|---|---|---|---|---|
| Demographics | % | CI | % | CI | % | CI | % | CI |
| All adults | 11 | 10-12 | 62 | 58-67 | 33 | 29-38 | 37 | 32-42 |
| Gender | ||||||||
| Male | 11 | 10-13 | 60 | 53-67 | 37 | 30-44 | 33 | 27-40 |
| Female | 10 | 9-11 | 65 | 58-71 | 30 | 24-36 | 41 | 35-48 |
| Age | ||||||||
| 18-29 | 1 | 1-2 | NSR | NSR | NSR | NSR | NSR | NSR |
| 30-44 | 4 | 3-6 | NSR | NSR | NSR | NSR | NSR | NSR |
| 45-64 | 13 | 12-15 | 68 | 61-74 | 35 | 28-42 | 38 | 31-45 |
| 65+ | 22 | 19-24 | 59 | 52-66 | 31 | 26-38 | 39 | 32-46 |
| Education | ||||||||
| < High school | 15 | 11-19 | NSR | NSR | NSR | NSR | NSR | NSR |
| High School | 13 | 11-14 | 67 | 61-74 | 33 | 26-40 | 37 | 30-44 |
| Some college | 10 | 9-12 | 57 | 48-66 | 33 | 26-42 | 33 | 25-41 |
| College degree | 6 | 5-8 | 55 | 45-64 | 28 | 21-36 | 36 | 28-45 |
| Household income | ||||||||
| < $15,000 | 19 | 15-23 | 69 | 57-80 | 38 | 26-50 | 46 | 33-59 |
| $15,000 to $24,999 | 15 | 12-18 | 60 | 49-71 | 36 | 26-47 | 38 | 28-50 |
| $25,000 to $49,999 | 12 | 10-15 | 66 | 56-74 | 36 | 28-45 | 35 | 27-44 |
| $50,000 to $74,999 | 7 | 5-9 | 66 | 54-77 | 36 | 24-50 | 28 | 18-40 |
| $75,000+ | 6 | 5-8 | 53 | 41-64 | 28 | 18-41 | 34 | 24-45 |
| Race | ||||||||
| White, non-Hispanic | 10 | 9-11 | 61 | 55-66 | 33 | 28-38 | 37 | 31-42 |
| Black, non-Hispanic | 15 | 12-18 | 77 | 65-85 | 40 | 29-53 | 39 | 27-51 |
| Hispanic | 10 | 6-14 | NSR | NSR | NSR | NSR | NSR | NSR |
| Sexual orientation | ||||||||
| Lesbian, gay or bisexual | 11 | 6-19 | NSR | NSR | NSR | NSR | NSR | NSR |
| Straight | 11 | 10-12 | 63 | 58-68 | 33 | 28-38 | 36 | 31-41 |
*Excludes missing, don't know and refused
**Denominator is persons who have diabetes
Note: If "NSR" is displayed, then the total response is less than 50 and/or the percentage prevalence is considered "not statistically reliable."
Approximately 9 million (3.7 percent) United States adults reported using an electronic cigarette or vaping product on a regular basis.12 The estimate(s) of adults who indicated they ever used an e-cigarette or other electronic vaping product, currently use an e-cigarette or other electronic vaping product every day, or currently use an e-cigarette or other electronic vaping product some days are shown below.
| Ever Used E-Cigarette or Other Electronic Vaping Product* | Currently Use E-Cigarette or Other Electronic Vaping Product Every Day* | Currently Use E-Cigarette or Other Electronic Vaping Product Some Days* | ||||
|---|---|---|---|---|---|---|
| Demographics | % | CI | % | CI | % | CI |
| All adults | 21 | 19-22 | 7 | 6-10 | 15 | 13-18 |
| Gender | ||||||
| Male | 24 | 22-26 | 8 | 5-11 | 16 | 13-21 |
| Female | 17 | 16-19 | 7 | 4-10 | 14 | 11-18 |
| Age | ||||||
| 18-29 | 37 | 33-41 | 5 | 3-8 | 13 | 9-19 |
| 30-44 | 30 | 26-33 | 9 | 6-14 | 15 | 10-21 |
| 45-64 | 15 | 14-17 | 9 | 6-15 | 19 | 14-24 |
| 65+ | 5 | 4-7 | 4 | 1-10 | 10 | 5-19 |
| Education | ||||||
| < High school | 21 | 16-28 | NSR | NSR | NSR | NSR |
| High school | 22 | 19-24 | 5 | 3-8 | 18 | 13-23 |
| Some college | 26 | 23-28 | 10 | 7-15 | 15 | 11-21 |
| College degree | 14 | 13-16 | 8 | 5-13 | 11 | 7-15 |
| Household income | ||||||
| < $15,000 | 25 | 20-30 | 4 | 2-10 | 20 | 12-33 |
| $15,000 to $24,999 | 22 | 18-26 | 10 | 5-18 | 16 | 11-25 |
| $25,000 to $49,999 | 23 | 20-26 | 5 | 2-10 | 12 | 8-17 |
| $50,000 to $74,999 | 24 | 20-28 | 8 | 4-16 | 18 | 11-27 |
| $75,000+ | 18 | 16-21 | 11 | 7-16 | 15 | 10-21 |
| Race | ||||||
| White, non-Hispanic | 20 | 19-22 | 8 | 6-11 | 16 | 13-20 |
| Black, non-Hispanic | 19 | 15-24 | 2 | 0-10 | 11 | 5-21 |
| Hispanic | 24 | 19-31 | 3 | 1-12 | NSR | NSR |
| Sexual orientation | ||||||
| Lesbian, gay or bisexual | 34 | 26-43 | 9 | 4-20 | NSR | NSR |
| Straight | 20 | 18-21 | 7 | 5-9 | 14 | 11-17 |
*Excludes missing, don't know and refused
Note: If "NSR" is displayed, then the total response is less than 50 and/or the percentage prevalence is considered "not statistically reliable."
Regular physical activity among adults has been shown to reduce the risk of many diseases including cardiovascular disease, diabetes, colon and breast cancers and osteoporosis. Keeping physically active also helps to control weight, maintain healthy bones, muscles, and joints, and relieve symptoms of depression.13 The estimate(s) of adults who indicated they met aerobic recommendations, met muscle strengthening recommendations, participated in no physical activity in the past month and participated in over 300 minutes of physical activity per week are shown below.
| Met Aerobic Recommendation* | Met Muscle Strengthening Recommendation* | Participated in No Physical Activity in the Past Month* ** | Participated in Over 300 Minutes of Physical Activity per Week* | |||||
|---|---|---|---|---|---|---|---|---|
| Demographics | % | CI | % | CI | % | CI | % | CI |
| All adults | 53 | 51-55 | 30 | 29-32 | 25 | 23-26 | 33 | 32-35 |
| Gender | ||||||||
| Male | 54 | 51-56 | 32 | 30-35 | 24 | 22-26 | 35 | 33-38 |
| Female | 52 | 50-55 | 28 | 26-31 | 26 | 24-28 | 31 | 29-34 |
| Age | ||||||||
| 18-29 | 59 | 55-63 | 44 | 40-49 | 14 | 11-17 | 33 | 28-37 |
| 30-44 | 49 | 45-52 | 33 | 30-36 | 25 | 22-28 | 29 | 26-32 |
| 45-64 | 53 | 50-55 | 26 | 24-28 | 25 | 23-28 | 34 | 32-37 |
| 65+ | 53 | 50-56 | 23 | 21-26 | 33 | 30-36 | 38 | 35-42 |
| Education | ||||||||
| < High school | 46 | 39-54 | 22 | 16-29 | 39 | 32-46 | 33 | 26-40 |
| High School | 47 | 44-50 | 26 | 23-29 | 32 | 29-35 | 31 | 29-34 |
| Some college | 57 | 54-60 | 32 | 29-35 | 20 | 18-23 | 35 | 32-38 |
| College degree | 58 | 56-61 | 38 | 36-40 | 15 | 13-17 | 35 | 33-38 |
| Household income | ||||||||
| < $15,000 | 42 | 36-48 | 25 | 20-30 | 37 | 31-42 | 27 | 22-33 |
| $15,000 to $24,999 | 46 | 41-51 | 22 | 18-26 | 37 | 32-42 | 30 | 26-35 |
| $25,000 to $49,999 | 53 | 49-56 | 30 | 27-33 | 28 | 24-31 | 32 | 28-35 |
| $50,000 to $74,999 | 54 | 49-58 | 29 | 26-33 | 23 | 19-27 | 33 | 29-37 |
| $75,000+ | 60 | 57-63 | 36 | 34-39 | 15 | 13-18 | 38 | 35-40 |
| Race | ||||||||
| White, non-Hispanic | 54 | 52-56 | 28 | 27-30 | 24 | 23-26 | 35 | 33-37 |
| Black, non-Hispanic | 51 | 45-57 | 38 | 33-44 | 25 | 20-30 | 29 | 24-34 |
| Hispanic | 47 | 39-55 | 42 | 34-50 | 32 | 25-40 | 29 | 22-37 |
| Sexual orientation | ||||||||
| Lesbian, gay or bisexual | 52 | 43-61 | 41 | 32-50 | 19 | 13-29 | 28 | 20-36 |
| Straight | 53 | 51-55 | 29 | 27-31 | 25 | 24-27 | 34 | 32-36 |
*Excludes missing, don't know and refused
**Odd years of survey include the following interviewer instruction: If respondent does not have a "regular job duty" or is retired, they may count the physical activity or exercise they spend the most time doing in a regular month.
Eating fruits and vegetables lowers the risk of developing many chronic diseases and can also help with weight management. Adults in the United States consume fruit about 1.1 times per day and vegetables about 1.6 times per day.14 The estimate(s) of adults who indicated they eat five or more fruits or vegetables daily, consume two or more fruits or 100% fruit juice daily or consume three or more vegetables or salads daily are shown below.
| Eat Five or More Fruits or Vegetables Daily* | Consume Two or More Fruits or 100% Fruit Juice Daily* | Consume Three or More Vegetables or Salads Daily* | ||||
|---|---|---|---|---|---|---|
| Demographics | % | CI | % | CI | % | CI |
| All adults | 8 | 7-9 | 24 | 22-26 | 11 | 10-12 |
| Gender | ||||||
| Male | 5 | 4-7 | 21 | 18-24 | 8 | 6-9 |
| Female | 10 | 8-13 | 27 | 23-30 | 15 | 13-17 |
| Age | ||||||
| 18-29 | 9 | 6-13 | 24 | 19-30 | 11 | 8-14 |
| 30-44 | 8 | 6-11 | 26 | 22-31 | 15 | 12-17 |
| 45-64 | 7 | 6-10 | 22 | 19-26 | 11 | 10-13 |
| 65+ | 6 | 4-10 | 23 | 19-28 | 8 | 7-10 |
| Education | ||||||
| < High school | 5 | 2-11 | 28 | 18-40 | 6 | 3-10 |
| High school | 7 | 5-10 | 21 | 18-25 | 8 | 6-10 |
| Some college | 7 | 5-9 | 21 | 17-25 | 13 | 11-15 |
| College degree | 11 | 9-14 | 28 | 25-32 | 16 | 14-18 |
| Household income | ||||||
| < $15,000 | 8 | 4-14 | 18 | 12-25 | 10 | 7-14 |
| $15,000 to $24,999 | 7 | 4-12 | 25 | 19-32 | 11 | 8-15 |
| $25,000 to $49,999 | 9 | 6-13 | 22 | 18-27 | 10 | 8-13 |
| $50,000 to $74,999 | 6 | 4-9 | 25 | 20-32 | 9 | 7-12 |
| $75,000+ | 9 | 7-12 | 26 | 22-30 | 15 | 13-17 |
| Race | ||||||
| White, non-Hispanic | 7 | 6-9 | 24 | 21-27 | 11 | 10-12 |
| Black, non-Hispanic | 9 | 5-16 | 25 | 19-33 | 13 | 9-17 |
| Hispanic | 7 | 3-14 | 20 | 13-30 | 13 | 8-20 |
| Sexual orientation | ||||||
| Lesbian, gay or bisexual | 12 | 6-25 | 17 | 10-26 | 14 | 9-22 |
| Straight | 7 | 6-9 | 23 | 21-26 | 11 | 10-12 |
*Excludes missing, don't know and refused
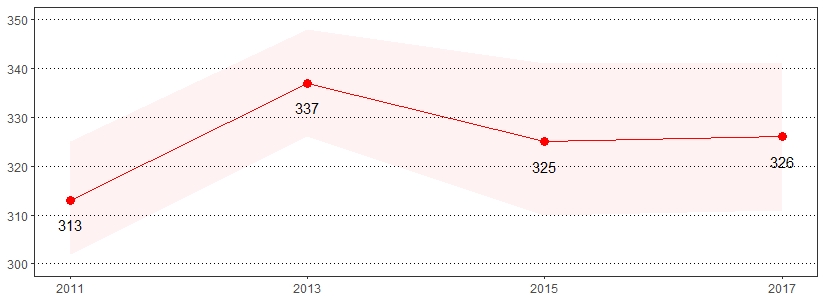
BRFSS respondents were asked to rate their general health as excellent, very good, good, fair or poor. The estimate(s) of adults who reported that their health was fair or poor are shown below.
| Fair or Poor General Health* | ||
|---|---|---|
| Demographics | % | CI |
| All Adults | 19 | 17-20 |
| Gender | ||
| Male | 19 | 17-21 |
| Female | 18 | 17-20 |
| Age | ||
| 18-29 | 11 | 8-14 |
| 30-44 | 14 | 12-17 |
| 45-64 | 22 | 20-24 |
| 65+ | 24 | 22-27 |
| Education | ||
| < High school | 36 | 29-42 |
| High school | 22 | 20-25 |
| Some college | 16 | 14-18 |
| College degree | 9 | 8-11 |
| Household income | ||
| < $15,000 | 43 | 38-49 |
| $15,000 to $24,999 | 29 | 25-34 |
| $25,000 to $49,999 | 20 | 17-23 |
| $50,000 to $74,999 | 13 | 10-16 |
| $75,000+ | 9 | 8-11 |
| Race | ||
| White, non-Hispanic | 18 | 16-19 |
| Black, non-Hispanic | 25 | 20-29 |
| Hispanic | 23 | 18-30 |
| Sexual orientation | ||
| Lesbian, gay or bisexual | 21 | 14-30 |
| Straight | 19 | 17-20 |
*Excludes missing, don't know and refused
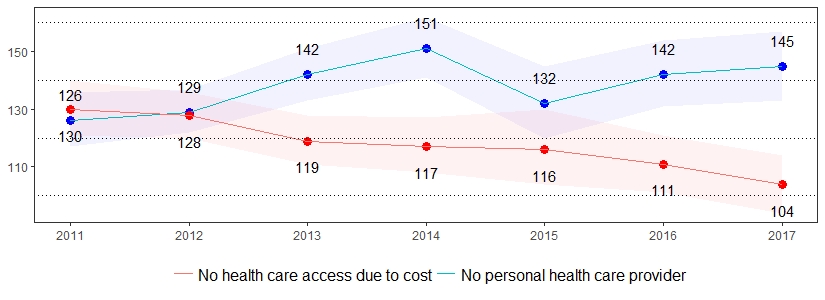
Two additional indicators related to health care access are: 1) not having a personal doctor or health care provider and 2) having had a time during the past 12 months when you needed to see a doctor but could not because of the cost. The estimate(s) of adults who indicated they have no personal health care provider, could not receive care in the past year due to cost, are age 65 and older and have Medicare coverage, and did not take prescribed medication in the past year due to cost are shown below.
| Does Not Have a Personal Health Care Provider* |
Couldn't Receive Care in the Past Year Due to Cost* | |||
|---|---|---|---|---|
| Demographics | % | CI | % | CI |
| All adults | 15 | 13-16 | 10 | 9-11 |
| Gender | ||||
| Male | 19 | 17-21 | 10 | 9-12 |
| Female | 11 | 9-12 | 10 | 9-12 |
| Age | ||||
| 18-29 | 31 | 27-35 | 13 | 10-16 |
| 30-44 | 21 | 18-24 | 13 | 11-16 |
| 45-64 | 8 | 7-10 | 11 | 10-13 |
| 65+ | 3 | 2-4 | 4 | 3-6 |
| Education | ||||
| < High school | 18 | 13-24 | 14 | 9-19 |
| High school | 14 | 13-17 | 10 | 8-11 |
| Some college | 15 | 13-18 | 12 | 10-14 |
| College degree | 13 | 11-14 | 8 | 7-10 |
| Household income | ||||
| < $15,000 | 17 | 13-22 | 18 | 14-23 |
| $15,000 to $24,999 | 14 | 11-17 | 17 | 14-20 |
| $25,000 to $49,999 | 17 | 14-20 | 12 | 10-14 |
| $50,000 to $74,999 | 15 | 12-19 | 9 | 7-12 |
| $75,000+ | 12 | 10-14 | 5 | 4-7 |
| Race | ||||
| White, non-Hispanic | 13 | 11-14 | 9 | 8-10 |
| Black, non-Hispanic | 16 | 12-20 | 14 | 11-18 |
| Hispanic | 27 | 21-34 | 16 | 11-22 |
| Sexual orientation | ||||
| Lesbian, gay or bisexual | 18 | 12-27 | 17 | 11-24 |
| Straight | 12 | 11-14 | 10 | 9-11 |
*Excludes missing, don't know and refused
Note: If "NSR" is displayed, then the total response is less than 50 and/or the percentage prevalence is considered "not statistically reliable."
Health care, or insurance coverage, includes private plans and plans such as Health Maintenance Organizations (HMOs) or governmental plans such as Medicare or the Indian Health Service. The estimate(s) of adults ages 18-64 who reported having no health care coverage are shown below.
| No Health Insurance, Age 18-64* | ||
|---|---|---|
| Demographics | % | CI |
| All adults | 9 | 7-10 |
| Gender | ||
| Male | 10 | 8-12 |
| Female | 7 | 6-9 |
| Age | ||
| 18-29 | 11 | 9-14 |
| 30-44 | 10 | 8-13 |
| 45-64 | 6 | 5-7 |
| Education | ||
| < High school | 23 | 17-31 |
| High school | 11 | 9-14 |
| Some college | 6 | 5-7 |
| College degree | 3 | 2-4 |
| Household income | ||
| < $15,000 | 17 | 12-23 |
| $15,000 to $24,999 | 14 | 10-18 |
| $25,000 to $49,999 | 10 | 8-13 |
| $50,000 to $74,999 | 9 | 6-13 |
| $75,000+ | 3 | 2-4 |
| Race | ||
| White, non-Hispanic | 7 | 6-8 |
| Black, non-Hispanic | 10 | 7-14 |
| Hispanic | 16 | 11-23 |
| Sexual orientation | ||
| Lesbian, gay or bisexual | 4 | 2-9 |
| Straight | 8 | 6-9 |
*Excludes missing, don't know and refused
Vision loss means that a person's eyesight is not corrected to a "normal" level. Vision loss can be caused by damage to the eye itself, by the eye being shaped incorrectly or even by a problem in the brain.15
Approximately 15 percent of American adults (37.5 million) report some trouble hearing.16 The estimate(s) of adults who indicated they were deaf or have serious difficulty hearing or were ever blind or have serious difficulty seeing, even when wearing glasses, are shown below.
| Deaf or Serious Difficulty Hearing* | Blind or Serious Difficulty Seeing, Even With Glasses* |
|||
|---|---|---|---|---|
| Demographics | % | CI | % | CI |
| All adults | 6 | 5-6 | 3 | 3-4 |
| Gender | ||||
| Male | 7 | 6-8 | 3 | 2-4 |
| Female | 5 | 4-6 | 3 | 3-4 |
| Age | ||||
| 18-29 | 2 | 1-4 | 2 | 1-3 |
| 30-44 | 3 | 2-4 | 2 | 1-4 |
| 45-64 | 5 | 4-7 | 4 | 3-5 |
| 65+ | 12 | 10-14 | 4 | 3-5 |
| Education | ||||
| < High school | 9 | 6-14 | 7 | 5-11 |
| High school | 6 | 5-8 | 3 | 3-4 |
| Some college | 5 | 4-6 | 3 | 2-4 |
| College degree | 4 | 3-5 | 1 | 1-2 |
| Household income | ||||
| < $15,000 | 9 | 6-13 | 12 | 9-15 |
| $15,000 to $24,999 | 8 | 6-11 | 6 | 5-9 |
| $25,000 to $49,999 | 6 | 5-8 | 2 | 1-3 |
| $50,000 to $74,999 | 5 | 3-7 | 1 | 1-2 |
| $75,000+ | 3 | 2-5 | 1 | 1-2 |
| Race | ||||
| White, non-Hispanic | 6 | 5-7 | 3 | 2-3 |
| Black, non-Hispanic | 5 | 3-8 | 5 | 3-8 |
| Hispanic | 7 | 4-13 | 6 | 3-11 |
| Sexual orientation | ||||
| Lesbian, gay or bisexual | 5 | 2-14 | 4 | 2-11 |
| Straight | 5 | 5-6 | 3 | 3-4 |
*Excludes missing, don't know and refused
Human Immunodeficiency Virus (HIV) is a virus spread through certain body fluids that attacks the body's immune system, specifically the CD4 cells, often called T cells.17 The estimate(s) of adults age 18-64 who indicated they were ever tested for HIV (except during a blood donation) or that an HIV situation applies to them are shown below.
| Ever Tested for HIV, Except Blood Donation* |
Tested for HIV in the Past Year, Except Blood Donation* | HIV Situation Applies* ** | ||||
|---|---|---|---|---|---|---|
| Demographics | % | CI | % | CI | % | CI |
| All adults | 43 | 41-45 | 14 | 13-16 | 7 | 6-9 |
| Gender | ||||||
| Male | 39 | 37-42 | 13 | 11-16 | 9 | 7-11 |
| Female | 47 | 44-49 | 16 | 13-18 | 6 | 5-7 |
| Age | ||||||
| 18-29 | 36 | 32-41 | 20 | 16-24 | 16 | 13-19 |
| 30-44 | 56 | 52-59 | 17 | 15-21 | 8 | 6-10 |
| 45-64 | 38 | 35-40 | 9 | 7-11 | 3 | 2-4 |
| Education | ||||||
| < High school | 44 | 35-54 | 19 | 12-29 | 7 | 3-15 |
| High school | 38 | 34-41 | 14 | 11-16 | 8 | 6-10 |
| Some college | 46 | 42-49 | 16 | 13-19 | 9 | 7-11 |
| College degree | 46 | 43-48 | 12 | 10-15 | 6 | 5-7 |
| Household income | ||||||
| < $15,000 | 58 | 51-65 | 32 | 24-41 | 9 | 6-13 |
| $15,000 to $24,999 | 53 | 47-59 | 25 | 19-32 | 7 | 5-11 |
| $25,000 to $49,999 | 45 | 41-50 | 16 | 13-20 | 7 | 6-10 |
| $50,000 to $74,999 | 40 | 35-45 | 10 | 8-14 | 7 | 5-11 |
| $75,000+ | 41 | 38-44 | 10 | 8-13 | 8 | 6-10 |
| Race | ||||||
| White, non-Hispanic | 38 | 36-40 | 10 | 9-12 | 7 | 6-8 |
| Black, non-Hispanic | 74 | 67-80 | 45 | 37-52 | 10 | 7-15 |
| Hispanic | 61 | 52-69 | 22 | 15-32 | 10 | 6-16 |
| Sexual orientation | ||||||
| Lesbian, gay or bisexual | 66 | 56-74 | 39 | 29-49 | 37 | 29-47 |
| Straight | 41 | 39-44 | 13 | 11-15 | 6 | 5-7 |
*Excludes missing, don't know and refused
**Defined as having used intravenous drugs, having been treated for a sexually transmitted or venereal disease, having given or received money or drugs in exchange for sex, had anal sex without a condom or had four or more sex partners in the past year
Adults with high blood pressure are at a higher risk for heart disease, stroke, congestive heart failure and end-stage renal disease.18 The estimate(s) of adults who reported they were ever told they have high blood pressure or are currently taking medicine for high blood pressure are shown below.
| Ever Told Have High Blood Pressure* | Currently Taking Medicine for High Blood Pressure* |
|||
|---|---|---|---|---|
| Demographics | % | CI | % | CI |
| All adults | 33 | 31-34 | 79 | 76-81 |
| Gender | ||||
| Male | 36 | 34-39 | 75 | 71-78 |
| Female | 29 | 27-31 | 83 | 80-86 |
| Age | ||||
| 18-29 | 9 | 7-12 | 15 | 8-27 |
| 30-44 | 17 | 14-20 | 49 | 40-58 |
| 45-64 | 38 | 36-41 | 82 | 78-84 |
| 65+ | 60 | 57-63 | 93 | 90-95 |
| Education | ||||
| < High school | 39 | 33-46 | 90 | 83-95 |
| High school | 37 | 35-40 | 80 | 76-83 |
| Some college | 32 | 29-34 | 72 | 66-76 |
| College degree | 25 | 23-27 | 77 | 73-80 |
| Household income | ||||
| < $15,000 | 42 | 36-47 | 77 | 70-83 |
| $15,000 to $24,999 | 42 | 38-46 | 84 | 79-89 |
| $25,000 to $49,999 | 35 | 32-38 | 78 | 73-82 |
| $50,000 to $74,999 | 28 | 25-32 | 73 | 66-80 |
| $75,000+ | 26 | 23-28 | 76 | 71-81 |
| Race | ||||
| White, non-Hispanic | 33 | 32-35 | 79 | 76-81 |
| Black, non-Hispanic | 41 | 36-46 | 81 | 75-87 |
| Hispanic | 19 | 14-26 | NSR | NSR |
| Sexual orientation | ||||
| Lesbian, gay or bisexual | 21 | 14-30 | NSR | NSR |
| Straight | 34 | 33-36 | 80 | 77-82 |
*Excludes missing, don't know and refused
Note: If "NSR" is displayed, then the total response is less than 50 and/or the percentage prevalence is considered "not statistically reliable."
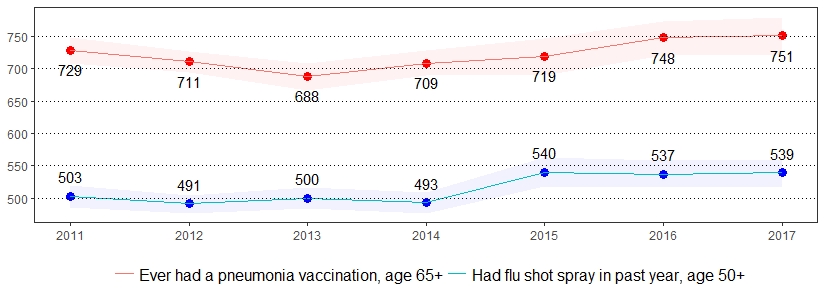
Adult immunizations against influenza and pneumococcal disease are important health indicators that need to be routinely monitored.19 The estimate(s) of adults who indicated they had a flu shot or flu vaccine that was sprayed in the nose in the past year, are age 65 and older and ever had a pneumonia vaccination or are age 60 and older and ever had a shingles or zoster vaccination are shown below.
| Had Flu Shot or Flu Vaccine Sprayed in Nose in the Past Year* | Ever Had Pneumonia Vaccination, Age 65+* | Ever Had Shingles or Zoster Vaccination, Age 60+* |
||||
|---|---|---|---|---|---|---|
| Demographics | % | CI | % | CI | % | CI |
| All adults | 44 | 43-46 | 75 | 72-78 | 40 | 37-43 |
| Gender | ||||||
| Male | 41 | 38-43 | 75 | 70-79 | 38 | 34-42 |
| Female | 48 | 46-50 | 76 | 71-79 | 42 | 38-45 |
| Age | ||||||
| 18-29 | 38 | 33-42 | NSR | NSR | NSR | NSR |
| 30-44 | 33 | 30-36 | NSR | NSR | NSR | NSR |
| 45-64 | 46 | 43-49 | NSR | NSR | NSR | NSR |
| 60+ | NSR | NSR | NSR | NSR | 40 | 37-43 |
| 65+ | 63 | 60-66 | 75 | 72-78 | NSR | NSR |
| Education | ||||||
| < High school | 40 | 33-47 | 71 | 59-81 | 33 | 24-43 |
| High school | 41 | 38-44 | 74 | 69-78 | 38 | 34-42 |
| Some college | 43 | 40-46 | 79 | 74-84 | 38 | 33-43 |
| College degree | 52 | 50-55 | 77 | 73-81 | 51 | 47-55 |
| Household income | ||||||
| < $15,000 | 42 | 36-48 | 71 | 59-80 | 31 | 23-41 |
| $15,000 to $24,999 | 45 | 41-50 | 70 | 61-77 | 34 | 29-41 |
| $25,000 to $49,999 | 43 | 39-46 | 81 | 77-86 | 41 | 36-46 |
| $50,000 to $74,999 | 42 | 38-46 | 75 | 67-82 | 45 | 38-52 |
| $75,000+ | 47 | 44-50 | 75 | 68-80 | 45 | 39-50 |
| Race | ||||||
| White, non-Hispanic | 45 | 43-47 | 76 | 73-79 | 41 | 39-44 |
| Black, non-Hispanic | 41 | 36-47 | 77 | 64-86 | 24 | 17-33 |
| Hispanic | 42 | 34-50 | NSR | NSR | NSR | NSR |
| Sexual orientation | ||||||
| Lesbian, gay or bisexual | 43 | 34-52 | NSR | NSR | NSR | NSR |
| Straight | 45 | 43-47 | 77 | 73-79 | 41 | 38-43 |
*Excludes missing, don't know and refused
Note: If "NSR" is displayed, then the total response is less than 50 and/or the percentage prevalence is considered "not statistically reliable."
Kidney disease is a condition in which the kidneys are damaged and are unable to filter blood properly. Adults with diabetes or hypertension are at an increased risk of kidney disease.20 The estimate(s) of adults who indicated they were ever told they have a kidney disease are shown below.
| Ever Told Have Kidney Disease* | ||
|---|---|---|
| Demographics | % | CI |
| All adults | 3 | 2-3 |
| Gender | ||
| Male | 3 | 2-4 |
| Female | 3 | 2-3 |
| Age | ||
| 18-29 | 0 | 0-1 |
| 30-44 | 2 | 1-3 |
| 45-64 | 3 | 2-4 |
| 65+ | 5 | 4-6 |
| Education | ||
| < High school | 4 | 2-7 |
| High school | 3 | 2-4 |
| Some college | 3 | 2-4 |
| College degree | 2 | 1-2 |
| Household income | ||
| < $15,000 | 5 | 3-8 |
| $15,000 to $24,999 | 4 | 3-6 |
| $25,000 to $49,999 | 3 | 2-4 |
| $50,000 to $74,999 | 2 | 1-3 |
| $75,000+ | 2 | 1-3 |
| Race | ||
| White, non-Hispanic | 3 | 2-3 |
| Black, non-Hispanic | 3 | 2-5 |
| Hispanic | 2 | 1-4 |
| Sexual orientation | ||
| Lesbian, gay or bisexual | 1 | 0-3 |
| Straight | 3 | 2-3 |
*Excludes missing, don't know and refused
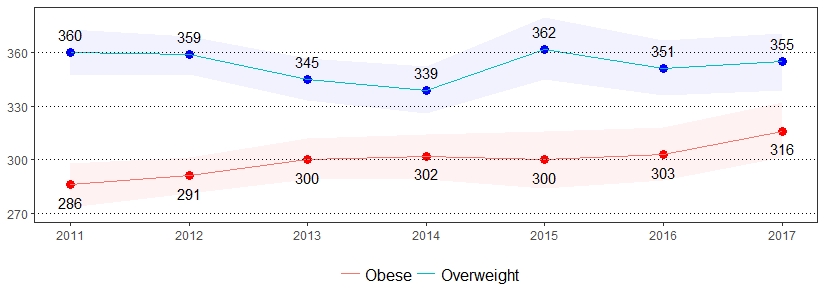
Being overweight or obese has been proven to increase the risk of many diseases and health conditions such as high blood pressure, diabetes, coronary heart disease, stroke, gallbladder disease, high cholesterol, and some forms of cancer.21 The estimate(s) of adults who indicated they were overweight, obese or overweight and obese are shown below.
| Overweight* (BMI 25-29) |
Obese* (BMI >= 30) |
Overweight & Obese* (BMI >= 25) |
||||
|---|---|---|---|---|---|---|
| Demographics | % | CI | % | CI | % | CI |
| All adults | 36 | 34-37 | 32 | 30-33 | 67 | 66-69 |
| Gender | ||||||
| Male | 41 | 38-43 | 33 | 30-35 | 73 | 71-76 |
| Female | 30 | 28-32 | 31 | 28-33 | 61 | 58-63 |
| Age | ||||||
| 18-29 | 27 | 23-31 | 20 | 17-24 | 47 | 42-51 |
| 30-44 | 37 | 34-41 | 32 | 29-36 | 70 | 66-73 |
| 45-64 | 38 | 35-40 | 37 | 34-40 | 75 | 72-77 |
| 65+ | 38 | 35-41 | 32 | 30-35 | 70 | 67-73 |
| Education | ||||||
| < High school | 34 | 27-41 | 36 | 29-43 | 70 | 63-76 |
| High school | 37 | 34-40 | 34 | 31-37 | 71 | 68-73 |
| Some college | 36 | 33-39 | 32 | 29-35 | 68 | 65-71 |
| College degree | 34 | 32-37 | 26 | 24-28 | 60 | 58-63 |
| Household income | ||||||
| < $15,000 | 29 | 24-34 | 38 | 32-44 | 66 | 61-72 |
| $15,000 to $24,999 | 35 | 31-40 | 36 | 32-41 | 71 | 67-75 |
| $25,000 to $49,999 | 37 | 33-40 | 31 | 28-34 | 67 | 64-71 |
| $50,000 tot $74,999 | 36 | 32-41 | 34 | 30-39 | 71 | 67-75 |
| $75,000+ | 37 | 34-40 | 29 | 26-32 | 66 | 63-68 |
| Race | ||||||
| White, non-Hispanic | 35 | 34-37 | 32 | 30-33 | 67 | 65-69 |
| Black, non-Hispanic | 35 | 30-40 | 38 | 33-44 | 73 | 68-77 |
| Hispanic | 39 | 31-46 | 25 | 19-32 | 64 | 56-71 |
| Sexual orientation | ||||||
| Lesbian, gay or bisexual | 29 | 22-38 | 30 | 23-39 | 60 | 50-68 |
| Straight | 36 | 34-38 | 33 | 31-34 | 69 | 67-70 |
*Excludes missing, don't know and refused
Note: The Body Mass Index (BMI), which describes relative weight for height, is significantly correlated with total body fat content. BMI is calculated as mass (kg)/height2 (m2) and estimated using pounds and inches by [weight (pound)/height2 (inches2)] x 703. Individuals with a BMI of 25 to 29.9 are considered overweight, while individuals with a BMI >= 30 are considered obese.
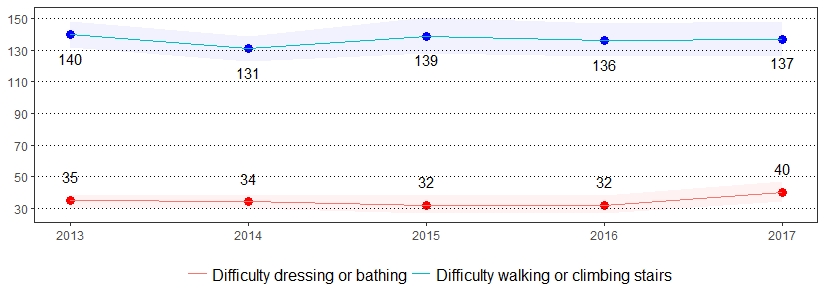
Impairment is an absence of, or significant difference in, a person's body structure or function or mental functioning.22 One in 25 United States adults reported having difficulty dressing or bathing, and one in 15 United States adults reported having difficulty doing errands alone due to a health condition.23 The estimate(s) of adults who indicated they had difficulty making decisions due to a health condition, had difficulty walking or climbing stairs, had difficulty dressing or bathing, or had difficulty doing errands alone due to a health condition are shown below.
| Have Difficulty Making Decisions Due to Health Condition* ** |
Have Difficulty Walking or Climbing Stairs* |
Have Difficulty Dressing or Bathing* | Have Difficulty Doing Errands Alone Due to Health Condition* ** |
|||||
|---|---|---|---|---|---|---|---|---|
| Demographics | % | CI | % | CI | % | CI | % | CI |
| All adults | 11 | 10-12 | 14 | 13-15 | 4 | 3-5 | 7 | 7-8 |
| Gender | ||||||||
| Male | 10 | 9-12 | 12 | 11-13 | 4 | 3-5 | 6 | 5-7 |
| Female | 12 | 11-14 | 15 | 14-17 | 4 | 3-5 | 9 | 8-10 |
| Age | ||||||||
| 18-29 | 13 | 10-16 | 3 | 2-6 | 1 | 0-2 | 4 | 2-5 |
| 30-44 | 12 | 10-15 | 7 | 5-9 | 3 | 2-5 | 6 | 5-8 |
| 45-64 | 12 | 10-14 | 18 | 17-21 | 6 | 5-7 | 9 | 8-11 |
| 65+ | 8 | 7-10 | 23 | 20-25 | 5 | 4-7 | 9 | 7-11 |
| Education | ||||||||
| < High school | 21 | 16-28 | 26 | 21-32 | 9 | 6-13 | 19 | 14-24 |
| High school | 12 | 11-14 | 17 | 15-19 | 4 | 3-5 | 8 | 6-9 |
| Some college | 11 | 9-13 | 12 | 10-14 | 4 | 3-6 | 7 | 5-8 |
| College degree | 6 | 5-7 | 7 | 6-8 | 2 | 1-2 | 3 | 3-4 |
| Household income | ||||||||
| < $15,000 | 28 | 23-33 | 32 | 27-37 | 14 | 10-18 | 22 | 18-26 |
| $15,000 to $24,999 | 20 | 17-24 | 26 | 22-30 | 9 | 6-12 | 17 | 13-21 |
| $25,000 to $49,999 | 9 | 7-11 | 14 | 12-17 | 3 | 2-5 | 6 | 4-8 |
| $50,000 to $74,999 | 9 | 7-12 | 8 | 7-11 | 2 | 1-4 | 3 | 2-5 |
| $75,000+ | 5 | 4-6 | 5 | 4-6 | 1 | 1-2 | 2 | 1-3 |
| Race | ||||||||
| White, non-Hispanic | 11 | 9-12 | 14 | 12-15 | 4 | 3-5 | 7 | 6-8 |
| Black, non-Hispanic | 13 | 10-16 | 17 | 13-21 | 5 | 3-7 | 10 | 7-13 |
| Hispanic | 16 | 12-23 | 11 | 7-17 | 4 | 2-9 | 9 | 6-15 |
| Sexual orientation | ||||||||
| Lesbian, gay or bisexual | 18 | 12-27 | 13 | 8-20 | 1 | 0-3 | 8 | 4-13 |
| Straight | 11 | 10-12 | 14 | 13-16 | 4 | 4-5 | 7 | 6-8 |
*Excludes missing, don't know and refused
**Includes physical, mental or emotional problems
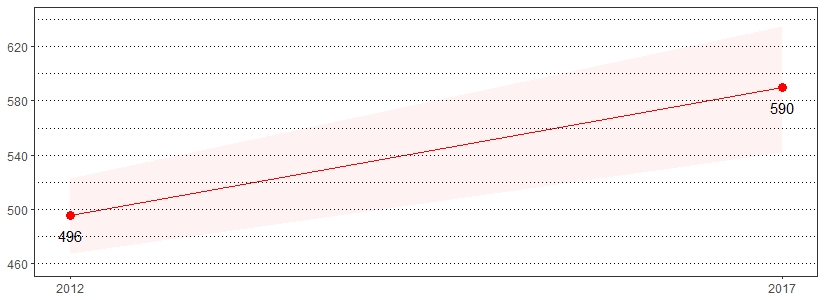
Preconception health refers to the health of women and men during their reproductive years, which are the years they can have a child. It focuses on taking steps now to protect the health of a baby they might have sometime in the future.24 The estimate(s) of women who indicated she or her husband/partner did something they last time they had sex to keep from getting pregnant are shown below.
| She or Husband/Partner Did Something Last Time They Had Sex to Keep From Getting Pregnant* |
||
|---|---|---|
| Demographics | % | CI |
| Gender | ||
| Female | 59 | 54-64 |
| Age | ||
| 18-29 | 65 | 57-73 |
| 30-44 | 54 | 49-60 |
| Education | ||
| < High school | NSR | NSR |
| High school | 47 | 38-56 |
| Some college | 60 | 52-67 |
| College degree | 71 | 65-76 |
| Household income | ||
| < $15,000 | NSR | NSR |
| $15,000 to $24,999 | 52 | 39-65 |
| $25,000 to $49,999 | 53 | 43-62 |
| $50,000 to $74,999 | 67 | 56-76 |
| $75,000+ | 67 | 59-74 |
| Race | ||
| White, non-Hispanic | 63 | 57-68 |
| Black, non-Hispanic | 45 | 33-57 |
| Hispanic | NSR | NSR |
| Sexual orientation | ||
| Lesbian, gay or bisexual | NSR | NSR |
| Straight | 60 | 55-65 |
*Excludes missing, don't know and refused
Note: If "NSR" is displayed, then the total response is less than 50 and/or the percentage prevalence is considered "not statistically reliable."
Each day, over 1,000 people are treated in emergency departments for misusing prescription opioids.25 The estimate(s) of adults who reported they used any prescription pain medications in the past year or used perscription pain medicines not prescribed to them in the past year are shown below.
| Used Any Prescription Pain Medications in the Past Year* |
Used Prescription Pain Medicines Not Prescribed to You in the Past Year* | |||
|---|---|---|---|---|
| Demographics | % | CI | % | CI |
| All adults | 32 | 30-33 | 3 | 2-4 |
| Gender | ||||
| Male | 29 | 27-32 | 4 | 3-6 |
| Female | 33 | 31-36 | 2 | 1-4 |
| Age | ||||
| 18-29 | 28 | 23-33 | 5 | 2-11 |
| 30-44 | 25 | 22-29 | 3 | 1-6 |
| 45-64 | 35 | 33-38 | 3 | 2-4 |
| 65+ | 35 | 32-38 | 3 | 2-5 |
| Education | ||||
| < High school | 40 | 32-48 | 1 | 0-5 |
| High school | 34 | 31-37 | 3 | 2-5 |
| Some college | 32 | 29-35 | 4 | 3-7 |
| College degree | 25 | 23-27 | 3 | 2-4 |
| Household income | ||||
| < $15,000 | 43 | 37-49 | 4 | 2-8 |
| $15,000 to $24,999 | 42 | 38-48 | 2 | 1-5 |
| $25,000 to $49,999 | 30 | 27-34 | 5 | 3-8 |
| $50,000 to $74,999 | 33 | 29-38 | 2 | 1-5 |
| $75,000+ | 24 | 22-27 | 2 | 1-6 |
| Race | ||||
| White, non-Hispanic | 31 | 29-32 | 3 | 2-5 |
| Black, non-Hispanic | 43 | 37-49 | 4 | 2-8 |
| Hispanic | 30 | 22-39 | 4 | 1-14 |
| Sexual orientation | ||||
| Lesbian, gay or bisexual | 32 | 24-40 | 1 | 0-6 |
| Straight | 32 | 30-33 | 3 | 2-4 |
*Excludes missing, don't know and refused
Note: No trend available. 2017 is the first year these questions were asked.
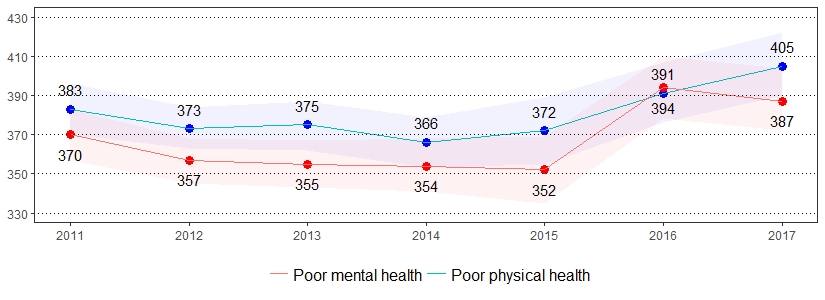
Physically and mentally unhealthy days measure the number of days within the past 30 days that individuals rate their physical and mental health as not good. The estimate(s) of adults who reported one or more physically or mentally unhealthy days are shown below.
| Physical Health Not Good 1+ Days in the Past Month* |
Mental Health Not Good 1+ Days in the Past Month* |
|||
|---|---|---|---|---|
| Demographics | % | CI | % | CI |
| All adults | 41 | 39-42 | 39 | 37-40 |
| Gender | ||||
| Male | 37 | 35-39 | 33 | 31-35 |
| Female | 44 | 42-46 | 44 | 42-47 |
| Age | ||||
| 18-29 | 39 | 35-44 | 52 | 48-57 |
| 30-44 | 38 | 35-42 | 46 | 43-50 |
| 45-64 | 43 | 40-46 | 36 | 33-38 |
| 65+ | 41 | 38-44 | 24 | 22-27 |
| Education | ||||
| < High school | 51 | 44-58 | 43 | 36-50 |
| High school | 41 | 38-44 | 37 | 34-40 |
| Some college | 41 | 38-44 | 41 | 38-44 |
| College degree | 36 | 33-38 | 37 | 35-40 |
| Household income | ||||
| < $15,000 | 57 | 51-63 | 52 | 46-58 |
| $15,000 to $24,999 | 50 | 45-54 | 44 | 39-48 |
| $25,000 to $49,999 | 39 | 36-43 | 37 | 34-41 |
| $50,000 to $74,999 | 35 | 31-39 | 36 | 32-40 |
| $75,000+ | 34 | 31-36 | 37 | 34-40 |
| Race | ||||
| White, non-Hispanic | 41 | 39-42 | 38 | 36-40 |
| Black, non-Hispanic | 42 | 37-47 | 41 | 36-46 |
| Hispanic | 43 | 36-50 | 44 | 37-52 |
| Sexual orientation | ||||
| Lesbian, gay or bisexual | 60 | 52-69 | 57 | 48-66 |
| Straight | 41 | 39-43 | 38 | 36-39 |
*Excludes missing, don't know and refused
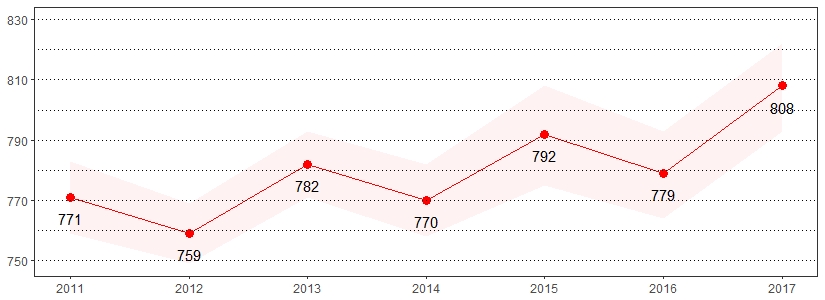
Seat belt use is the most effective way to save lives and reduce injuries in crashes.26 Seat belts have saved an estimated 318,000 lives between 1975 and 2013.27 The estimate(s) of adults who indicated they always use seatbelts when driving or riding in a car, always or nearly always use seatbelts when driving or riding in a car, or seldom or never use seatbelts when driving or riding in a car are shown below.
| Always Use Seatbelts When Driving or Riding in a Car* | Always or Nearly Always Use Seatbelts When Driving or Riding in a Car* | Seldom or Never Use Seatbelts When Driving or Riding in a Car* | ||||
|---|---|---|---|---|---|---|
| Demographics | % | CI | % | CI | % | CI |
| All adults | 81 | 79-82 | 90 | 88-91 | 6 | 5-7 |
| Gender | ||||||
| Male | 75 | 72-77 | 86 | 84-88 | 8 | 7-10 |
| Female | 86 | 85-88 | 93 | 91-94 | 4 | 3-5 |
| Age | ||||||
| 18-29 | 75 | 71-79 | 86 | 82-89 | 6 | 4-9 |
| 30-44 | 77 | 74-80 | 89 | 86-91 | 8 | 6-10 |
| 45-64 | 84 | 82-86 | 92 | 90-93 | 5 | 4-7 |
| 65+ | 84 | 81-87 | 91 | 89-93 | 5 | 4-7 |
| Education | ||||||
| < High school | 66 | 58-73 | 76 | 69-82 | 15 | 10-20 |
| High school | 78 | 76-81 | 88 | 86-89 | 7 | 6-9 |
| Some college | 81 | 78-83 | 91 | 89-92 | 5 | 3-6 |
| College degree | 90 | 88-91 | 96 | 95-97 | 2 | 2-3 |
| Household income | ||||||
| < $15,000 | 72 | 65-77 | 80 | 73-85 | 11 | 8-17 |
| $15,000 to $24,999 | 78 | 75-82 | 85 | 82-88 | 8 | 6-11 |
| $25,000 to $49,999 | 80 | 77-83 | 89 | 87-91 | 6 | 5-9 |
| $50,000 to $74,999 | 79 | 74-83 | 89 | 85-92 | 6 | 4-8 |
| $75,000+ | 86 | 83-88 | 94 | 92-96 | 5 | 3-7 |
| Race | ||||||
| White, non-Hispanic | 81 | 80-83 | 90 | 89-91 | 6 | 5-7 |
| Black, non-Hispanic | 77 | 73-82 | 87 | 84-91 | 5 | 4-8 |
| Hispanic | 76 | 68-82 | 87 | 80-91 | 7 | 4-12 |
| Sexual orientation | ||||||
| Lesbian, gay or bisexual | 80 | 72-86 | 86 | 78-92 | 6 | 3-15 |
| Straight | 81 | 79-82 | 90 | 88-91 | 6 | 5-7 |
*Excludes missing, don't know and refused
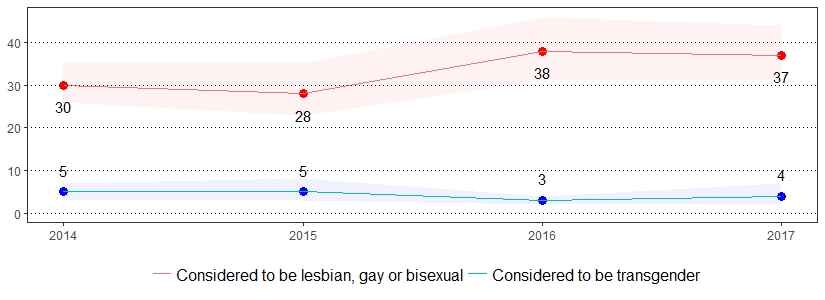
Approximately, 1.4 million adults in the United States identify as transgender.28 The estimate(s) of adults who indicated they were considered lesbian, gay or bisexual or were considered transgender are shown below.
| Considered to be Lesbian, Gay or Bisexual* | Considered to be Transgender* | |||
|---|---|---|---|---|
| Demographics | % | CI | % | CI |
| All adults | 4 | 3-4 | 0 | 0-1 |
| Gender | ||||
| Male | 4 | 3-5 | 0 | 0-1 |
| Female | 4 | 3-5 | 0 | 0-1 |
| Age | ||||
| 18-29 | 9 | 7-12 | 1 | 0-2 |
| 30-44 | 4 | 3-6 | 0 | 0-1 |
| 45-64 | 2 | 2-3 | 0 | 0-1 |
| 65+ | 2 | 1-3 | 0 | 0-1 |
| Education | ||||
| < High school | 2 | 1-6 | 1 | 0-3 |
| High school | 3 | 2-4 | 1 | 0-1 |
| Some college | 5 | 3-6 | 0 | 0-1 |
| College degree | 4 | 3-5 | 0 | 0-0 |
| Household income | ||||
| < $15,000 | 5 | 3-10 | 0 | 0-2 |
| $15,000 to $24,999 | 3 | 2-5 | 0 | 0-3 |
| $25,000 to $49,999 | 5 | 3-6 | 0 | 0-1 |
| $50,000 to $74,999 | 3 | 2-5 | 1 | 0-3 |
| $75,000+ | 3 | 2-5 | 0 | 0-1 |
| Race | ||||
| White, non-Hispanic | 3 | 3-4 | 0 | 0-1 |
| Black, non-Hispanic | 5 | 3-9 | 0 | 0-1 |
| Hispanic | 5 | 3-9 | 0 | 0-2 |
| Sexual orientation | ||||
| Lesbian, gay or bisexual | NSR | NSR | 4 | 2-9 |
| Straight | NSR | NSR | 0 | 0-1 |
*Excludes missing, don't know and refused
Note: If "NSR" is displayed, then the total response is less than 50 and/or the percentage prevalence is considered "not statistically reliable."
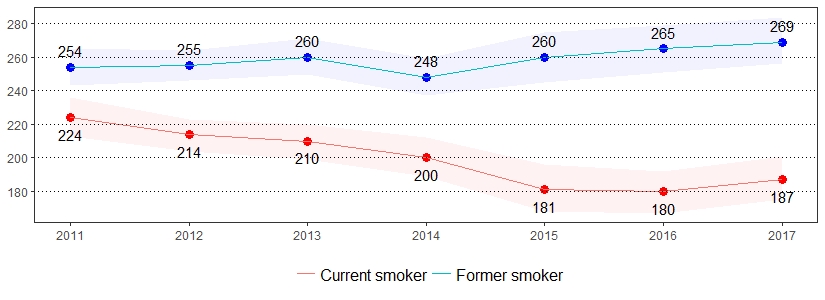
Cigarette smoking is the leading cause of preventable death in the United States, accounting for more than 480,000 deaths each year.30 Quitting smoking greatly reduces the risk of developing smoking-related diseases. Currently, there are more former smokers than current smokers in the United States.31 The estimate(s) of adults who indicated they are a current smoker, former smoker, have quit at least one day in the past year, or currently use chewing tobacco, snuff or snus are shown below.
| Current Smoker* ** | Currently Use Chewing Tobacco, Snuff or Snus* *** |
Former Smoker* | Quit at Least 1 Day in the Past Year* ** |
|||||
|---|---|---|---|---|---|---|---|---|
| Demographics | % | CI | % | CI | % | CI | % | CI |
| All adults | 19 | 17-20 | 4 | 3-5 | 27 | 26-28 | 50 | 45-54 |
| Gender | ||||||||
| Male | 21 | 19-23 | 7 | 6-9 | 32 | 30-34 | 47 | 40-53 |
| Female | 17 | 15-19 | 1 | 0-1 | 22 | 21-24 | 53 | 47-60 |
| Age | ||||||||
| 18-29 | 18 | 15-21 | 7 | 5-10 | 9 | 7-11 | 58 | 45-70 |
| 30-44 | 25 | 22-28 | 5 | 4-7 | 25 | 22-28 | 53 | 44-62 |
| 45-64 | 22 | 20-24 | 3 | 3-5 | 28 | 25-30 | 45 | 39-52 |
| 65+ | 10 | 8-11 | 1 | 1-2 | 43 | 39-46 | 43 | 33-55 |
| Education | ||||||||
| < High school | 30 | 25-37 | 6 | 3-10 | 27 | 22-34 | NSR | NSR |
| High school | 23 | 20-25 | 6 | 5-7 | 28 | 25-30 | 46 | 40-53 |
| Some college | 20 | 18-23 | 3 | 2-4 | 27 | 24-30 | 54 | 46-62 |
| College degree | 8 | 7-9 | 2 | 1-3 | 26 | 24-28 | 60 | 51-69 |
| Household income | ||||||||
| < $15,000 | 31 | 26-37 | 3 | 2-5 | 20 | 16-25 | 49 | 36-63 |
| $15,000 to $24,999 | 28 | 24-33 | 4 | 3-6 | 26 | 23-30 | 54 | 45-64 |
| $25,000 to $49,999 | 21 | 19-24 | 5 | 3-6 | 26 | 24-29 | 50 | 42-59 |
| $50,000 to $74,999 | 18 | 15-22 | 4 | 3-6 | 31 | 27-35 | 51 | 39-63 |
| $75,000+ | 11 | 10-14 | 4 | 3-6 | 29 | 27-32 | 48 | 36-60 |
| Race | ||||||||
| White, non-Hispanic | 19 | 17-20 | 4 | 4-5 | 29 | 28-31 | 48 | 43-53 |
| Black, non-Hispanic | 20 | 16-24 | 1 | 1-3 | 21 | 17-25 | 62 | 48-74 |
| Hispanic | 20 | 15-27 | 4 | 2-7 | 15 | 10-21 | NSR | NSR |
| Sexual orientation | ||||||||
| Lesbian, gay or bisexual | 23 | 17-31 | 2 | 1-5 | 27 | 19-36 | NSR | NSR |
| Straight | 18 | 17-20 | 4 | 4-5 | 28 | 27-30 | 48 | 43-53 |
*Excludes missing, don't know and refused
**Includes adults who smoke cigarettes every day or some days
***Includes adults who currently use chewing tobacco, snuff or snus every day or some days
Note: If "NSR" is displayed, then the total response is less than 50 and/or the percentage prevalence is considered "not statistically reliable."

Social determinants of health are the conditions in the places where people live, learn, work and play that affect a wide range of health risks and outcomes.29 The estimate(s) of adults who indicated they were not able to pay mortgage, rent or utility bills at least once in the past year, consider their neighborhood to be unsafe or extremely unsafe, often did not have money to buy extra food or often did not have money to eat balanced meals are shown below.
Social Determinants of Health, Pennsylvania Adults, 2017
*Excludes missing, don't know and refused
Note: No trend available. 2017 is the first year these questions were asked.